How Much Revenue Are You Losing to Amazon Resellers? A Framework
Introduction
It's a question most brands can't answer with any confidence: how much is reseller activity on Amazon actually costing? Without a framework for estimating reseller revenue loss on Amazon, the problem tends to stay abstract — annoying, but not urgent enough to prioritise. This article offers a simple method for putting a real number on it.
What we'll cover:
- Why this is hard to estimate without a framework
- The four numbers you need
- Walking through the calculation with a real example
- What this number does and doesn't tell you
- What to do once you have it
Why reseller revenue loss is hard to estimate without a framework
The difficulty isn't the maths — it's that the inputs aren't usually sitting in one place. Knowing how many resellers are active, what they're charging, and what share of total sales they're actually capturing requires pulling together information from a few different sources rather than reading it off a single dashboard.
Most brands either ignore the problem entirely (because it feels unquantifiable) or dramatically underestimate it (because they only look at the most obvious reseller, not all of them). A structured framework forces you to be specific about each variable rather than making a rough mental estimate.
The four numbers you need to calculate Amazon reseller revenue loss
1. Average monthly units sold on the affected listing. This is your baseline volume — find it in your Seller Central sales reports.
2. Your RRP. The price you'd be selling at if you had full control of the listing.
3. The price gap. How far below your RRP the lowest reseller price sits, as a percentage. Check the "Other Sellers on Amazon" section on your listing or use a price tracking tool for a 30-day average.
4. The affected share. An estimate of what percentage of total units are being captured by resellers rather than sold at your intended price. This is the hardest number to pin down precisely, but even a reasonable estimate based on Buy Box share over a sample period is more useful than no estimate at all.
Walking through the calculation
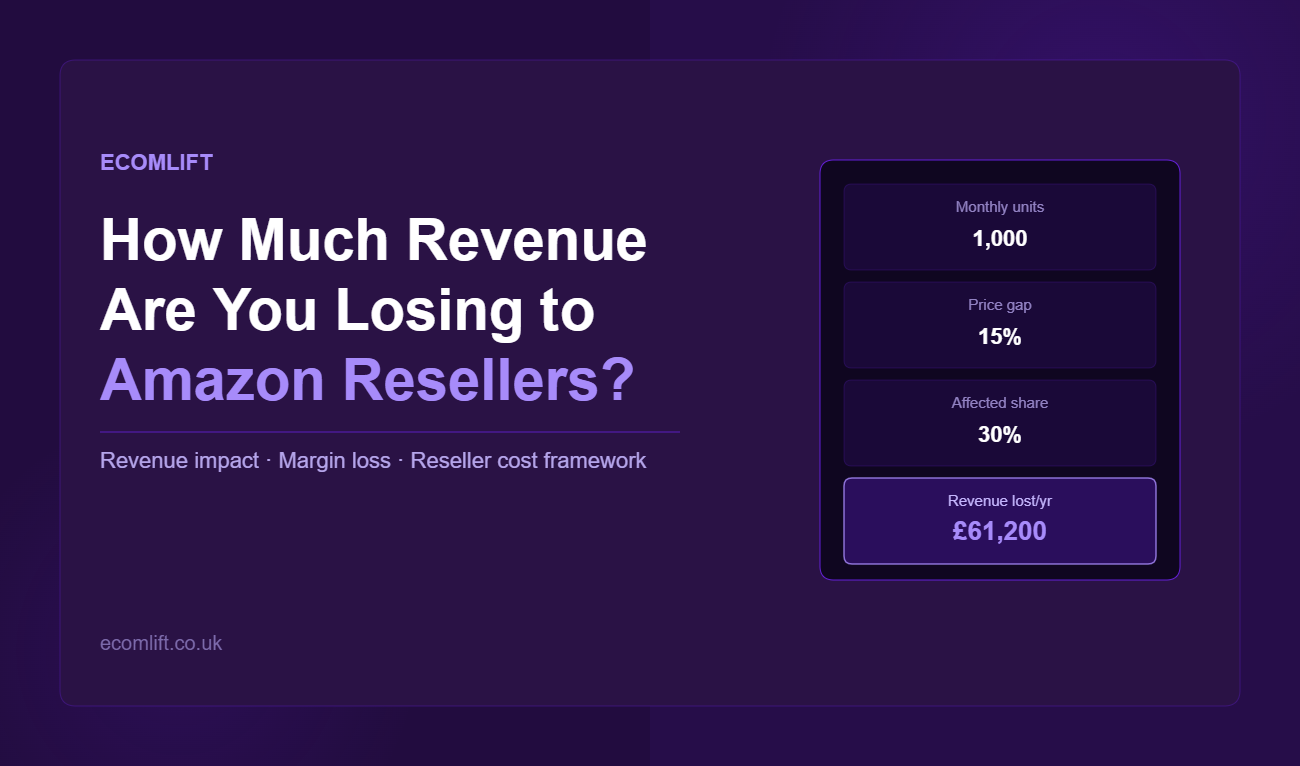
Take a real-world scenario: a home and garden brand selling a £20 product on Amazon. They have two unauthorised resellers on the listing, the lowest priced at £17 — 15% below RRP. Based on two weeks of monitoring Buy Box ownership, resellers are capturing roughly 30% of total sales. Monthly volume is approximately 1,000 units.
- Affected units: 1,000 × 30% = 300 units per month
- Reseller price: £20 × (1 − 15%) = £17
- Revenue diverted per month: 300 × £17 = £5,100
- Annualised: £5,100 × 12 = £61,200
This is revenue that would otherwise have transacted at the brand's RRP through their own controlled listing, now instead flowing through a reseller at a discounted price — generating no margin for the brand and no control over the customer experience.
A related, slightly different number worth calculating separately is the margin impact. Applying a 35% margin to the affected units gives a monthly profit loss of approximately £1,785, or over £21,000 per year — just from reseller activity on a single listing.
What this number does and doesn't tell you
This framework gives a reasonable estimate, not a precise audit figure. It's built on assumptions — particularly the affected share — that are inherently approximate without deeper account-level data. What it's genuinely useful for is moving the problem from "this feels annoying" to "this is costing roughly this much a year," which tends to clarify how much time and resource is worth investing in actually fixing it.
It's also worth noting this framework only captures the direct revenue and margin impact. It doesn't account for the secondary effects — wasted advertising spend funding reseller sales, brand trust erosion from inconsistent pricing, or the operational time spent monitoring and reporting violations — all of which add real, if harder to quantify, cost on top.
What to do once you have the number
A meaningful number tends to prompt one of two reasonable next steps: investing more seriously in monitoring and MAP enforcement to reduce the affected share over time, or consolidating to a single controlled seller of record to remove the competition at its root rather than continuing to manage it reactively.
Either way, the first step is usually getting an accurate picture of the actual numbers on your specific account, rather than working from a rough estimate.
At Ecomlift, we help established brands take back control of their Amazon channel, from reseller management and pricing control to listings and advertising, so you can protect your margins and build a stronger, more stable presence on the marketplace.
Frequently asked questions
How accurate is this kind of estimate without a full account audit?
It's a reasonable approximation, useful for understanding scale, but a full audit of your actual account data will always be more precise than an estimate built on assumed inputs.
What's a realistic "affected share" estimate if I have no data at all?
This varies hugely by category and how long reseller activity has gone unaddressed — a brief period of self-monitoring (checking Buy Box ownership daily for a couple of weeks) gives a much better starting estimate than a guess.
Does this framework apply to multiple listings, or just one?
The same calculation can be run per listing and added together for a total channel figure, though affected share often varies meaningfully between listings.
Should I include lost future sales, like repeat customers lost to a bad reseller experience?
This framework intentionally focuses on direct, calculable revenue and margin impact. Longer-term effects like brand trust erosion are real but much harder to quantify reliably.
What counts as an "affected unit" in this framework?
An affected unit is one that was sold at a reseller's discounted price rather than your RRP through your own controlled listing. In practice, this is approximated by multiplying your total monthly units by the estimated Buy Box share held by resellers during the same period.
How do I find out what share of the Buy Box resellers are holding?
The most accessible method is manual monitoring — check who holds the Buy Box on your listing at different times of day over a period of one to two weeks and record the results. Some third-party Amazon analytics tools also track Buy Box ownership percentage automatically over time.
Can this framework be used to make a business case for investing in reseller control?
Yes — this is one of its most practical uses. If the annualised revenue impact is significant (say, £50,000+), it's straightforward to demonstrate that the cost of a dedicated partner or monitoring tool is justified by the revenue currently being lost.
SIGN UP TO OUR
NEWSLETTER
Subscribe to the Sell Smarter newsletter to get weekly e-commerce insights, Amazon best practices and exclusive tips from our expert team. Delivered straight to your inbox.